In today’s data-driven world, businesses rely heavily on segmentation to uncover patterns, predict behavior, and make smarter decisions—an approach that also strengthens. SEO optimization strategy by helping brands create content aligned with specific audience segments and search intent. But choosing the right clustering method can feel overwhelming. Should you use K-means? Is hierarchical clustering better? When does DBSCAN make sense?
This guide offers a practical clustering algorithms comparison to help you choose the right approach for your business or analytics project. We’ll break down K-means vs hierarchical clustering, explore key DBSCAN use cases, and help you design a strong machine learning clustering strategy that aligns with your data and goals.
Why Your Clustering Strategy Matters
Clustering is an unsupervised machine learning technique that groups similar data points together. Unlike classification, clustering doesn’t rely on predefined labels. Instead, it uncovers hidden structures within data.
Businesses use clustering to:
-
Segment customers
-
Detect fraud
-
Identify buying patterns
-
Optimize pricing
-
Improve recommendation systems
-
Analyze geographic expansion opportunities
But the success of your analysis depends heavily on choosing the right algorithm. Each clustering method makes different assumptions about your data.
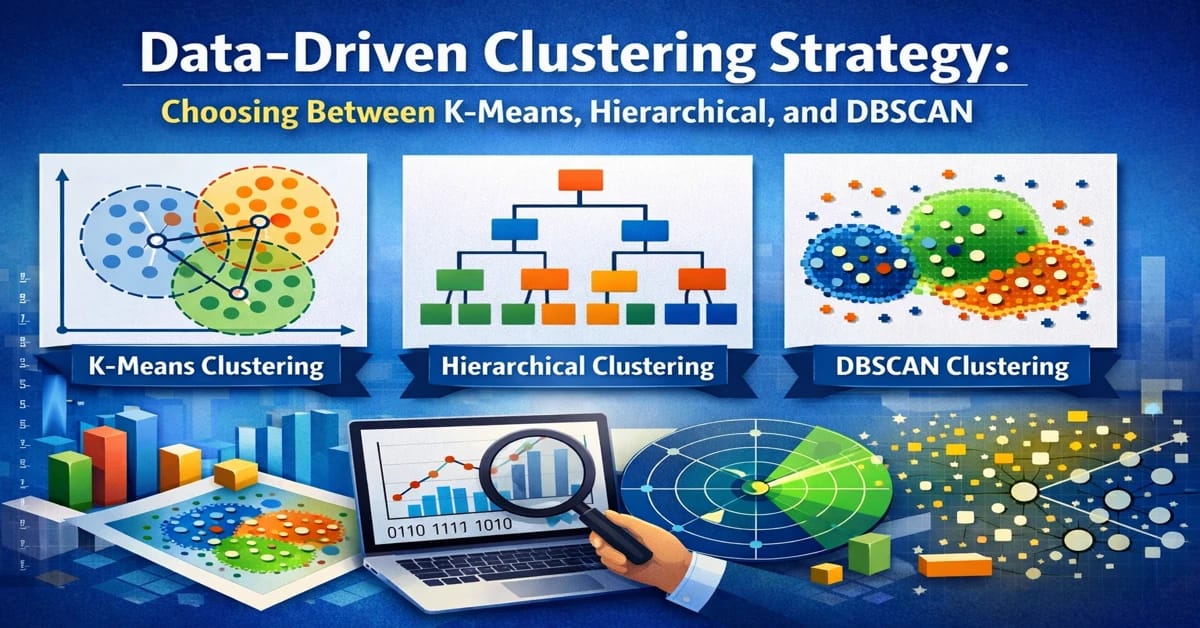
Let’s examine the three most widely used clustering techniques.
1. K Means Clustering
K-means is one of the most popular clustering algorithms because it is simple, fast, and scalable.
How K Means Works
K-means divides data into K clusters. It:
-
Selects K initial centroids
-
Assigns each data point to the nearest centroid
-
Recalculates centroid positions
-
Repeats the process until clusters stabilize
The algorithm minimizes the distance between data points and their assigned centroid.
When to Use K Means
K-means works best when:
-
You know the number of clusters in advance
-
Your clusters are roughly spherical
-
Your dataset is large
-
Your data is numerical and properly scaled
It is widely used in customer segmentation, product categorization, and behavioral analysis.
Strengths of K Means
-
Fast and computationally efficient
-
Easy to implement
-
Scales well to large datasets
-
Works well for clearly separated groups
Limitations of K Means
-
You must predefine the number of clusters
-
Struggles with irregular cluster shapes
-
Sensitive to outliers
-
Requires feature scaling
If your data is clean and structured, K-means often delivers excellent results. But real-world data isn’t always that simple.
2. Hierarchical Clustering
Hierarchical clustering builds clusters step by step, forming a tree-like structure called a dendrogram.
There are two types:
-
Agglomerative (bottom-up)
-
Divisive (top-down)
Agglomerative clustering is the most commonly used. It starts by treating each data point as its own cluster and gradually merges the closest clusters together.
How Hierarchical Clustering Works
The algorithm:
-
Calculates distances between all data points
-
Merges the closest pair
-
Recalculates distances
-
Repeats until one large cluster remains
You can then “cut” the dendrogram at any level to choose the number of clusters.
When to Use Hierarchical Clustering
Hierarchical clustering is ideal when:
-
You don’t know how many clusters you need
-
You want to visualize relationships between groups
-
You’re working with smaller datasets
-
Interpretability is important
It is commonly used in market research, bioinformatics, and document classification.
Strengths of Hierarchical Clustering
-
No need to predefine cluster count
-
Produces a visual hierarchy
-
Works well for small datasets
-
Flexible distance metrics
Limitations of Hierarchical Clustering
-
Computationally expensive for large datasets
-
Sensitive to noise and outliers
-
Once merged, clusters cannot be split
When comparing K-means vs hierarchical clustering, the main difference lies in scalability and flexibility. K-means is faster and better for large datasets, while hierarchical clustering offers more interpretability and doesn’t require predefined clusters.
3. DBSCAN (Density Based Spatial Clustering of Applications with Noise)
DBSCAN takes a completely different approach. Instead of focusing on distance from centroids, it groups data points based on density.
This makes DBSCAN powerful for complex datasets.
How DBSCAN Works
DBSCAN requires two parameters:
-
Epsilon (ε): the maximum distance between two points
-
MinPts: minimum number of points to form a dense region
The algorithm:
-
Identifies dense areas
-
Expands clusters from dense regions
-
Marks low-density points as noise
Unlike K-means, DBSCAN does not require you to specify the number of clusters.
When to Use DBSCAN
Common DBSCAN use cases include:
-
Fraud detection
-
Geographic clustering
-
Anomaly detection
-
Spatial data analysis
-
Identifying irregular cluster shapes
DBSCAN performs especially well when clusters are uneven or non-spherical.
Strengths of DBSCAN
-
Automatically detects number of clusters
-
Handles irregular shapes
-
Identifies noise and outliers
-
Works well for spatial datasets
Limitations of DBSCAN
-
Parameter tuning can be tricky
-
Struggles when densities vary significantly
-
Less effective in very high-dimensional data
If your data includes noise or unusual patterns, DBSCAN may outperform both K-means and hierarchical clustering.
Clustering Algorithms Comparison: Side by Side
Here’s a simplified comparison to guide your decision:
| Feature | K-Means | Hierarchical | DBSCAN |
|---|---|---|---|
| Need to specify clusters | Yes, | No | No |
| Handles irregular shapes | No | Limited | Yes |
| Handles noise/outliers | Poor | Poor | Excellent |
| Scales to large data | Excellent | Poor | Moderate |
| Produces hierarchy | No | Yes | No |
This clustering algorithms comparison highlights a key insight: there is no universally “best” method. The right choice depends on your dataset and objective.
How to Choose the Right Machine Learning Clustering Strategy
Follow this practical decision framework:
1. Define Your Goal
Are you segmenting customers? Detecting fraud? Exploring unknown structures?
Clear objectives guide algorithm selection.
2. Analyze Your Data Shape
-
Round, evenly sized clusters → K-means
-
Nested or hierarchical relationships → Hierarchical clustering
-
Irregular shapes or noisy data → DBSCAN
3. Consider Dataset Size
-
Large datasets (millions of rows) → K-means
-
Small to medium datasets → Hierarchical
-
Medium datasets with spatial patterns → DBSCAN
4. Evaluate Interpretability Needs
If stakeholders need visual explanation, hierarchical clustering provides intuitive dendrograms.
If speed matters most, K-means is often the better choice.
Real World Example
Imagine a retail company analyzing store locations.
-
If they want quick segmentation of customers based on spending → K-means works well.
-
If they want to understand layered buying relationships → hierarchical clustering provides structure.
-
If they want to detect unusual geographic buying patterns → DBSCAN identifies dense purchase zones and anomalies.
The same data can produce different insights depending on the algorithm chosen.
That’s why a thoughtful machine learning clustering strategy matters.
Final Thoughts
Choosing between K-means, hierarchical clustering, and DBSCAN isn’t about finding the most advanced algorithm. It’s about aligning the method with your data and business objectives.
In summary:
-
Use K-means for speed, scalability, and clearly separated groups.
-
Use hierarchical clustering when you need flexibility and interpretability.
-
Use DBSCAN when working with noisy, irregular, or spatial datasets.
A smart clustering algorithms comparison always starts with understanding your data first—not the tool.
When you apply the right clustering approach, you move beyond guesswork. You uncover patterns, improve segmentation, and make data-driven decisions that truly impact growth.